Stage Details in GoCD
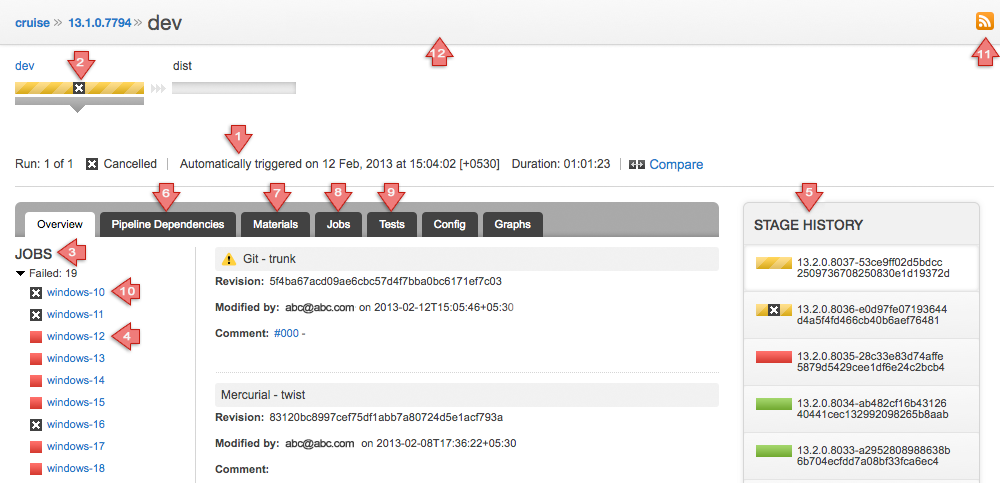
The "Stage Details" page displays details of a specific stage.

Key
- Details of a specific stage run: run number, status, when it was triggered, who triggered it and duration of the stage
- Name of the stage
- The jobs in this stage are grouped by status: Passed, Failed, Cancelled, In Progress. Expand these sections to see the jobs
- Failed jobs: Click the job name to view details for that job.
- "Stage History" shows the status and the pipeline label in which this stage has run. The latest 10 are shown by default. The rest are paginated, the user can select to view the details of this particular stage in any of the pipeline instances. This will indicate if the stage was a re-run and show the stage counter. Click on the stage instance in the stage history section to view the stage details page for that stage
- Displays a graphical visualization of the pipeline dependency chain
- Lists all the material changes that were part of the build in this stage
- Displays detailed information about the jobs in this stage
- Shows the failed build history for tests failing in the stage
- Cancelled job. Click the job name to view job details for that job
- RSS feed for the stage in Atom format
- Name of the stage
Failed Build History
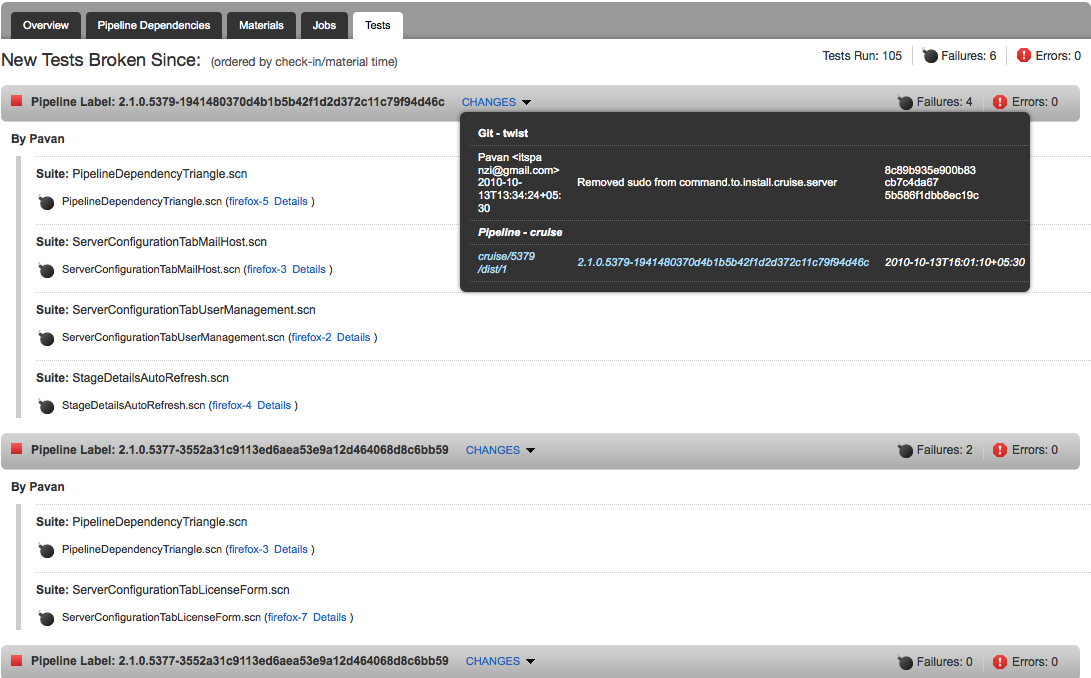
Results of test runs from jobs within a stage are aggregated up to the stage level. Failures are listed under the relevant pipeline instance label. Tests listed are ones that are failing in the stage instance currently being viewed. The tests are grouped by pipeline instance in which they started to fail (and are still failing). This gives you information about which users' checkins are responsible for test failures. On clicking the "Changes" link next to the Pipeline Label, the popup shows you the modifications to materials that are built in this instance of the pipeline. All the stage instances till the time this stage was last seen green are listed in the failed build history. The pipelines are sorted by natural ordering.
Test Failures in the current stage
Other information that the "Tests" tab on the "Stage Details" page shows: (Image not annotated)

- Total number of tests run
- Total number of failures
- Total number of errors
- Failing test names grouped by the test suites in which they ran
- Details link next to each of the job names which gives a popup with the failure/error message with a stack trace caused by the test
- Users whose check-ins are responsible for the failing test in a given instance.
- Pipeline labels where the currently failing tests started failing and are still failing in the instance being viewed.
- The names of the jobs in which the test ran. Clicking on the job name will take you to the job details page.
- Shows modifications which caused the stage instance to be triggered.
- Shows the failure message and stack trace for the test failure/error for that job.
Example 1
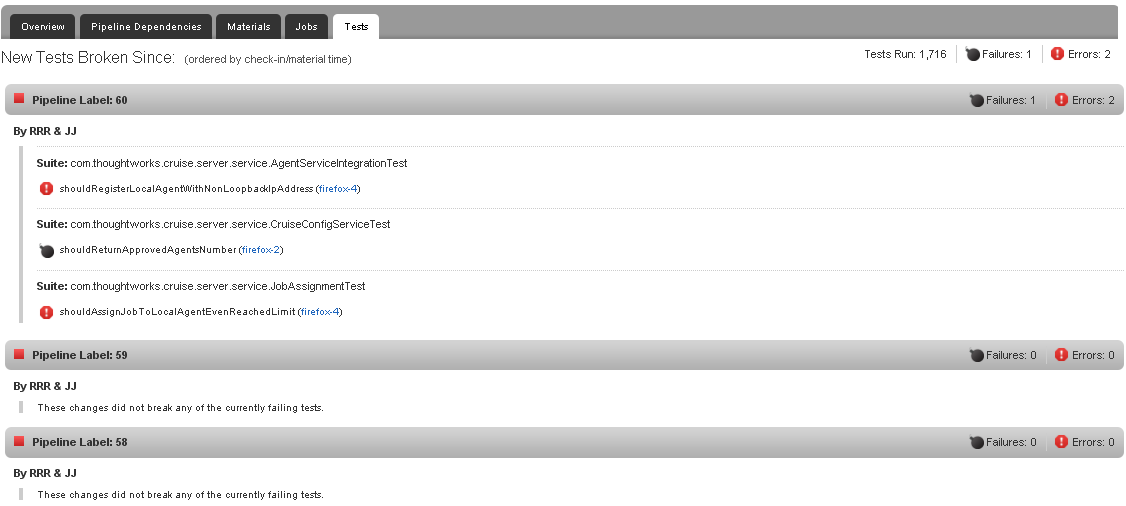
You are viewing stage 'Dev' of pipeline label '60'. The pipeline has been failing since label '59'. There are currently 4 failing tests. This is how they are listed.

- 60 has 3 failing test all of which started failing in 60
- 59 and 58 are listed because the 'dev' stage failed but none of the currently failing tests started failing because of the changes in 59 or 58. This could be because the tests that were failing in 59 got fixed by the checkins in 60. But these check-ins broke other tests. Or this could be because none of the test ran in 59 and 58, an error occured before the tests started running.
- The pipeline instances are listed in natural order. In this case the schedule and natural order are the same.
Example 2
You are viewing stage 'Dev' of pipeline label '59'. The pipeline has been failing since label '65'. There are currently 6 failing tests. This is how they are listed.

- The natural order of pipelines is 61, 60, 65, 59, 58, 57, 56, 55. This is the order in which they are listed.
- 65's changes caused 2 failing test which are still failing in 61 (instance being viewed).
- 60 had 1 new failing test which is still failing in 61.
- 61 has 3 newly failing tests.
- None of the currently failing tests started failing in 59, 58. 57, 56 or 55.
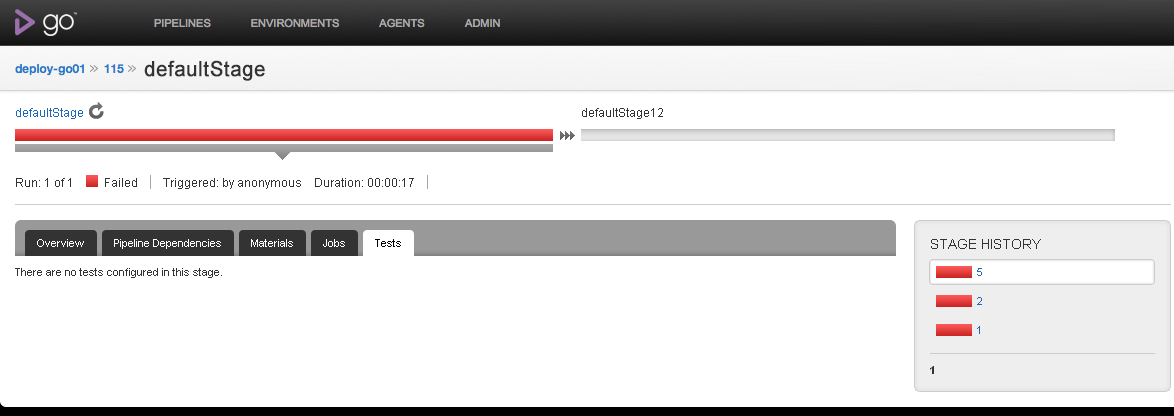
If there are no tests configured in the stage or GoCD is still computing results, this is the message that is displayed.
